Am I a Bad Friend?
I analysed 20 years of my chats and turned 1.2M messages into a structured vault of my life - to win friends and influence people. Instead, I learnt things about my emotional bandwidth, endearment cycles, and friendship half-lives.
In 2014, Tim Urban of WaitButWhy published Your Life in Weeks - a grid where each square is one week of one's life, and most of the grid is already filled. The image bothered me for years. I started tracking things partly because of it - I wanted the grid to mean something, not just count down. But the biometric data is an odd representation of how fulfilling my life has been. The grid suggests it's the events that matter - jobs, trips, schools, marriages - and those are easy to mark. But they hardly tell how I felt during those weeks, or what I was like to the people around me. That was what I wanted to measure.
So I tried journaling. Paper first, then text files, then daily notes in Obsidian. The journal captured what I thought was important on the day I wrote it. It missed the conversations I forgot to jot down or the slow-moving patterns I couldn't see at the time.
Tired of being bad at maintaining relationships[1]1. Not bad per se - I just procrastinate a lot. Once I learnt to shoot and stalk deer because I wanted to cook a steak - and cooking is way easier than human interactions. and wanting the data to compensate, I set off on a quest to build a personal CRM of sorts, built from the record rather than from memory - thanks to the trail left by my prolific time-wasting on the Internet for the past few decades.
My digital history 
My online presence breaks into roughly three eras:
- ICQ, IRC, DC++ in 2000s: midnight channels for script kiddies and banter - all gone, and probably for the best. The ten-year-old I was in those chats doesn't need a structured archive.
- VK[2]2. A now-obscure social network, popular in the post-Soviet space in the noughties. I haven't been to Russia for a decade or so, but the archives going back to 2008 are still there. Gotta love totalitarian states, eh?, Twitter, Facebook in 2010s: school, university, early career - evenly spread.
- Instagram and Telegram in 2010s-2020s: surprisingly, even though I don't post much on Instagram, it's often easier to catch up with people in DMs, and there are more and more people swapping WhatsApp for Telegram too.
Armed with GDPR and data access laws, I got myself archives with all my messages, reactions, and social graphs.
Data archives 
Parsing a bunch of JSONs and HTMLs wasn't hard but wasn't fun either. Instagram double-encodes Cyrillic through latin-1. Telegram assigns different internal message IDs between exports taken at different dates. Facebook introduced E2E encryption at some point, so the same messages show up in three different folders. Telegram lets you export group chats or just your own messages. VK exports everything without asking. Instagram doesn't differentiate between broadcasts and personal chats at all.
Once parsed into a uniform tab-separated format, the five exports produce different kinds of signal. Telegram and VK are mostly DMs. Instagram adds story interactions and a follower graph. Twitter is its own thing: standalone tweets are a publication corpus, DMs are half support requests and half conference coordination, so I needed the reply/mention graph to catch real signals.
I wanted to capture a daily note per conversation-day, a profile per person, a stub per place, a life timeline, and whatever else surfaces - recipes, cocktails, meeting notes.
Drowning in noise 
Before worrying about classification, you have to deal with the fact that most of the data is noise.
In my longest thread - 486,000+ messages with my partner across ten years - the content has 2.4% links, 9.1% media, 1.5% emoji-only messages, 28.4% of short fillers, and 58.7% of substantive text. This means, 41% is noise for the purpose of this exercise. Emojis, links, and media were easy to filter, but catching conversational filler words - short words that look like content until you see them hundreds of times per month - is harder.
My first idea was filtering out all messages shorter than three words, but there is a lot that can be said in two (he died, we lost, etc). Building a denylist of hahahas and noices didn't work either, especially across languages.
What worked was sampling from five offset positions across the chat, frequency-counting every short token, reviewing the top 80 manually, and pair the denylist with a protected set for short messages that are life events.
Across all platforms and years, the cleaned corpus contains roughly 52,000 unique lemmas. The novelty rate - the share of words I hadn't used before in any chat - has been declining since 2008 and plateaued at 6% six years ago. Most of my vocabulary was locked in my early 20s.
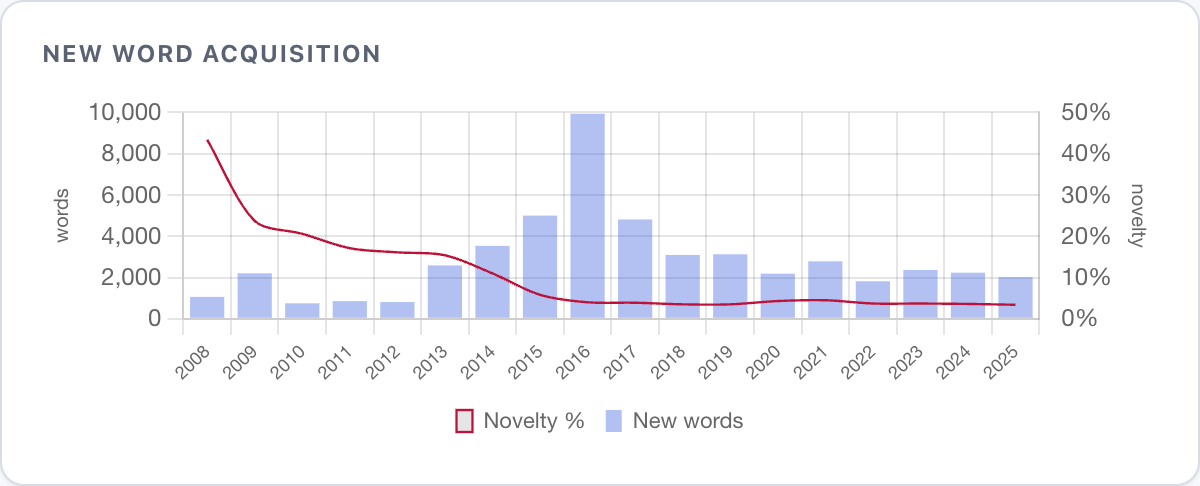
With the noise filtered, the cleaned messages need classification: what's a life event, what's banter, who's being mentioned, what's the emotional temperature. But before any of that, there's a more basic problem.
Which Sasha 
Most people I interact with use more than one platform, and often don't share usernames across them. If I were to maintain a profile for each known person, I'd need to map them (and mentions of them) across all chats.
Cue diminutives and nicknames: the same Alexander might turn into Al, Alex, Xander, Sandy, and Alec(k). It can also be Sasha, if they're from Eastern Europe - and in Slavic languages Sasha is gender-neutral[3]3. Slavic languages often use a "-sha" suffix to create endearing diminutives, e.g Paul = Pavel = Pasha, Maria = Masha, Innokentiy = Kesha.. Morphological analysers help with case inflection but won't handle slang, and "Sasha" in my chats means a handful of different people depending on when the message was sent and who I'm talking to.
Heuristics and NER models won't cut it for thousands of first-name-only mentions in group chats. A classifier trained on message content could work[4]4. Fine-tune a BERT model on labelled name-resolution pairs, predict which "Sasha" based on surrounding topics., but the training set would need to be hand-labelled from my own chats - exactly the kind of work I was trying to avoid.
Parsing them all 
The same problem is with classifying what matters.
The obvious approach is keyword matching on first-person verbs (bought, moved, signed) piped through NER to extract names and places, but it produces a lot of false positives. "I moved" in a message to my mom is a relocation, while "I moved" in a friends' chat is interior design, and "I moved" after a breakup is an emotional milestone.
Fine-tuning a classifier on hand-labelled messages would give me ~70-80% accuracy at best[5]5. BERT tops out at 75.6% F1 on event detection (Xi et al, MUSIED 2022) with a professionally annotated corpus in a single domain - I suspect multilingual banter with a small hand-labelled training set would do much worse. - and at 1.2 million messages, even 1% false-positive rate means 12,000 fake events in the vault.
So I ended up using LLMs[6]6. In total I ran 200+ sessions, roughly 15-20 billion tokens including context. On Opus, that's around $15k. On an M5 Pro 32 GB running Qwen3-30B-A3B locally via MLX, it's around 10-15 weeks of continuous inference. Pick your poison. for both name-resolution and classification. Measured against a 200-event holdout set, the false-positive rate was under 1% when processing chunks below 6,000 messages.
The LLM doesn't write to the vault. It reads a chunk of messages and produces a structured JSON manifest - daily note bullets with dates and sentiment tags, entity profile facts, life timeline events, place updates, and a list of ambiguities it couldn't resolve ("msg 833006: 'John' without surname - which John?"). A deterministic script reads this JSON and injects the bullets. Each bullet carries a (chat:: tg/chat_NNN) (msg:: 730372 - 730650) provenance marker pointing back to the source. An SQLite provenance store tracks every output bullet back to its source message, so a bad session can be rolled back surgically. Everything deterministic - parsing, filtering, deduplication, provenance tracking - stays in Python, so no actual messages make it into the vault but I can always track their content down using original archives as the source of truth.
Training the prompt 
The prompt file that governs the LLM's behaviour started at 8 KB but quickly grew tenfold, primarely from mistakes.
For example, the model read a thread where I walked a friend through iPhone Uprade Program pricing math and wrote a purchase event to my life timeline, so I had to add a first-person possession test - no life-event classification without explicit first-person markers in the source ("I bought", "I signed").
A closure gate - a validation script that runs before marking any chat as done - catches some of this mechanically: orphan wikilinks, duplicate citations, language bleed. But it can't catch confabulation, so I've added sampling: pick 5-10 outputs at random after each batch, check them against the source. The model's self-reported confidence should never be a quality signal.
Directional sentiment 
At this point I had structured data - people, places, events, hobbies, recipes. But I also wanted to know how my relationships felt.
Standard sentiment analysis assigns one polarity per message: positive, negative, neutral. If one person is enthusiastic and the other is giving one-word replies, VADER would tag the conversation as positive, but the reality is asymmetric[7]7. Poria et al. (2019) showed you can't assign emotion to a conversation without tracking who said what. A message from Person A might read as angry in isolation but is sarcasm in context of their usual tone with Person B.: one side is warm, the other is flat, and that delta is what makes it interesting.
You could build this with classical ML - per-speaker emotion classification, then combine into pairs - but close friendships are warm by default. The signal isn't absolute emotion, it's departure from baseline. A message tagged joy means nothing if every message in this relationship gets tagged joy. You need the model to understand what normal looks like for this specific pair, or you'll get friendly banter tagged as "flirting".
The big mistake I made here was to tell LLM, hey, go and tag each conversation-day with sentiment. After running through roughly 9000 conversation days I got a bunch of free-text sentiment - 5,700+ unique values like WWDC-binge-mode and garden-prep.
I ended up redoing it with 18 tags and three directional prefixes (my emotional state, counterpart's, and mutual):
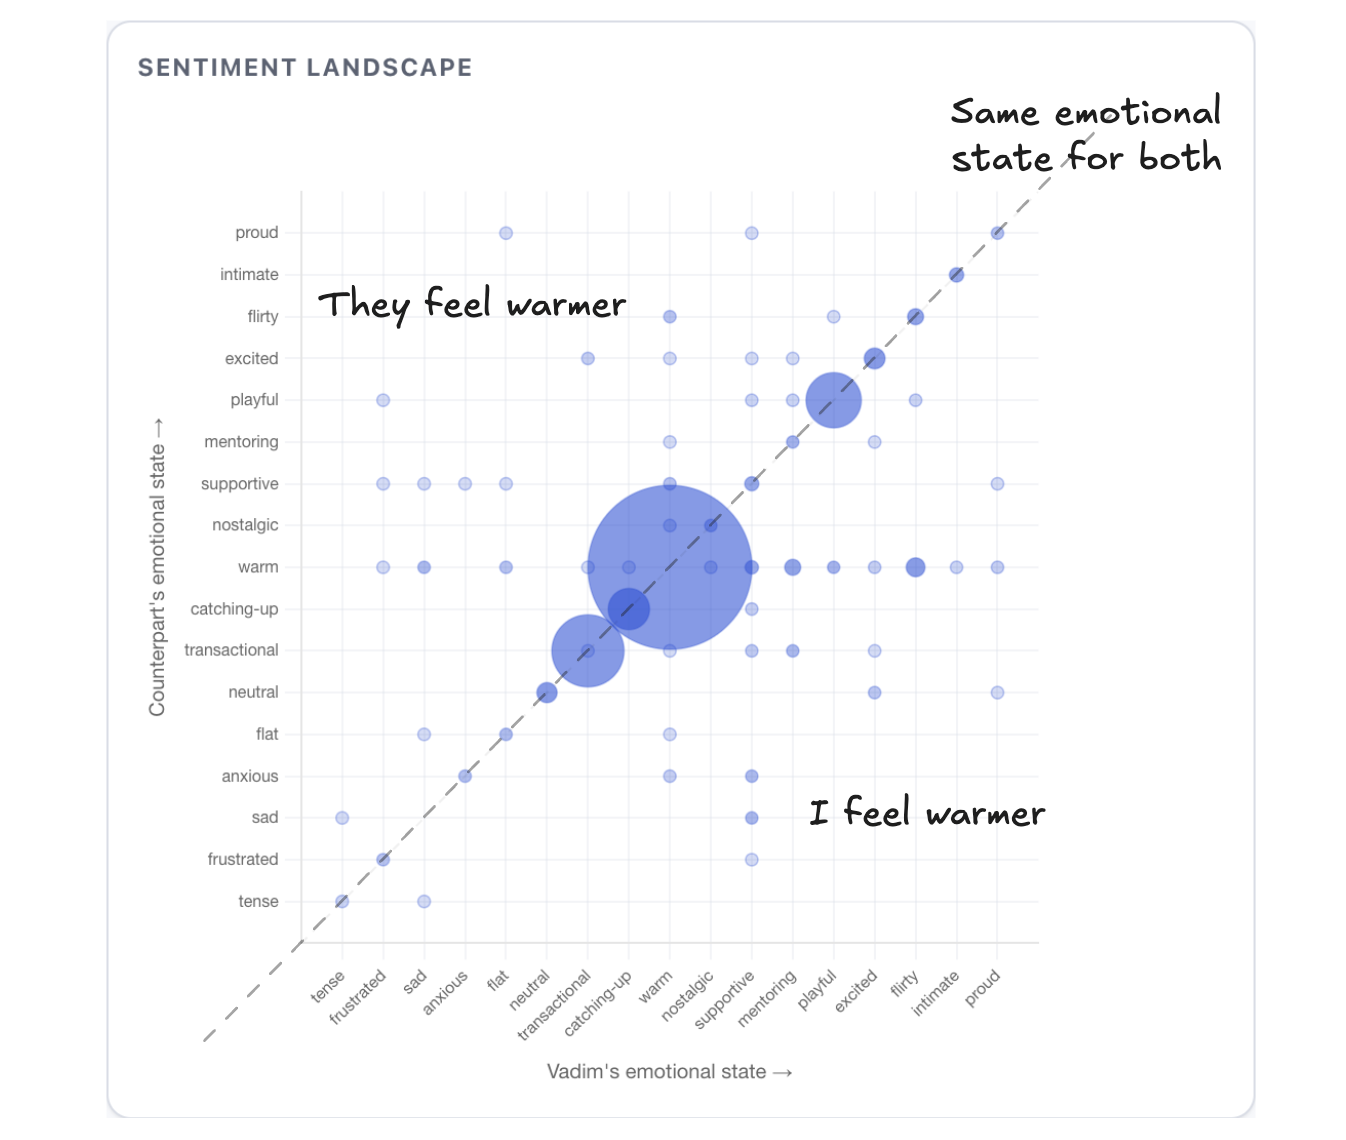
Given the dataset that's mostly friends and family, 66% M:warm was expected[8]8. What I didn't expect is finding out that on average, 12.9% of my conversations each month are transactional - but in March it's 17%. I have the UK tax-year-end to blame.. The interesting data is the change over time. A friendship shifting from M:playful to M:transactional across 18 months is drifting, and I don't think that's something I could notice one conversation at a time.
What the data shows 
Was there anything I could notice though? The messages volume seems most obvious - it might be less obvious in the moment, and sometimes life, work, or holidays happen, but surely the drop should mean something.
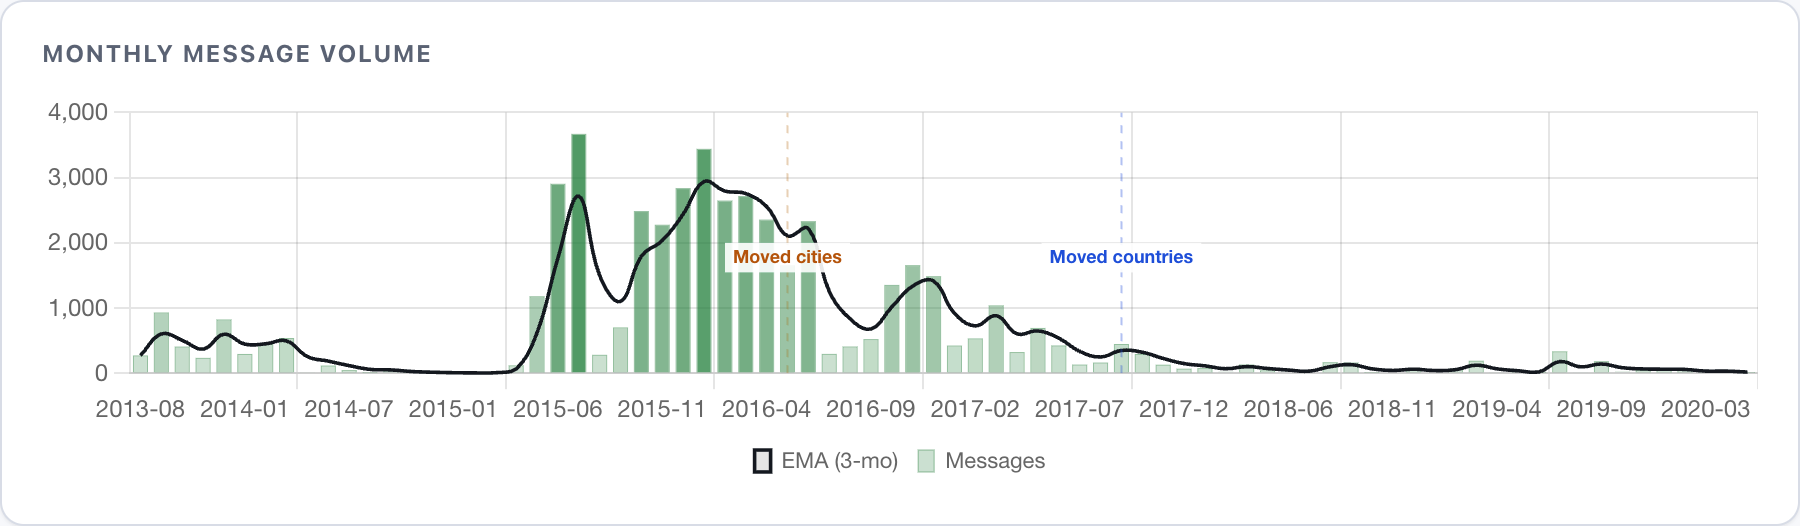
Interestingly enough, the amount of messages might drop, but their average length could increase too - so the friendship doesn't die, it just changes shape.
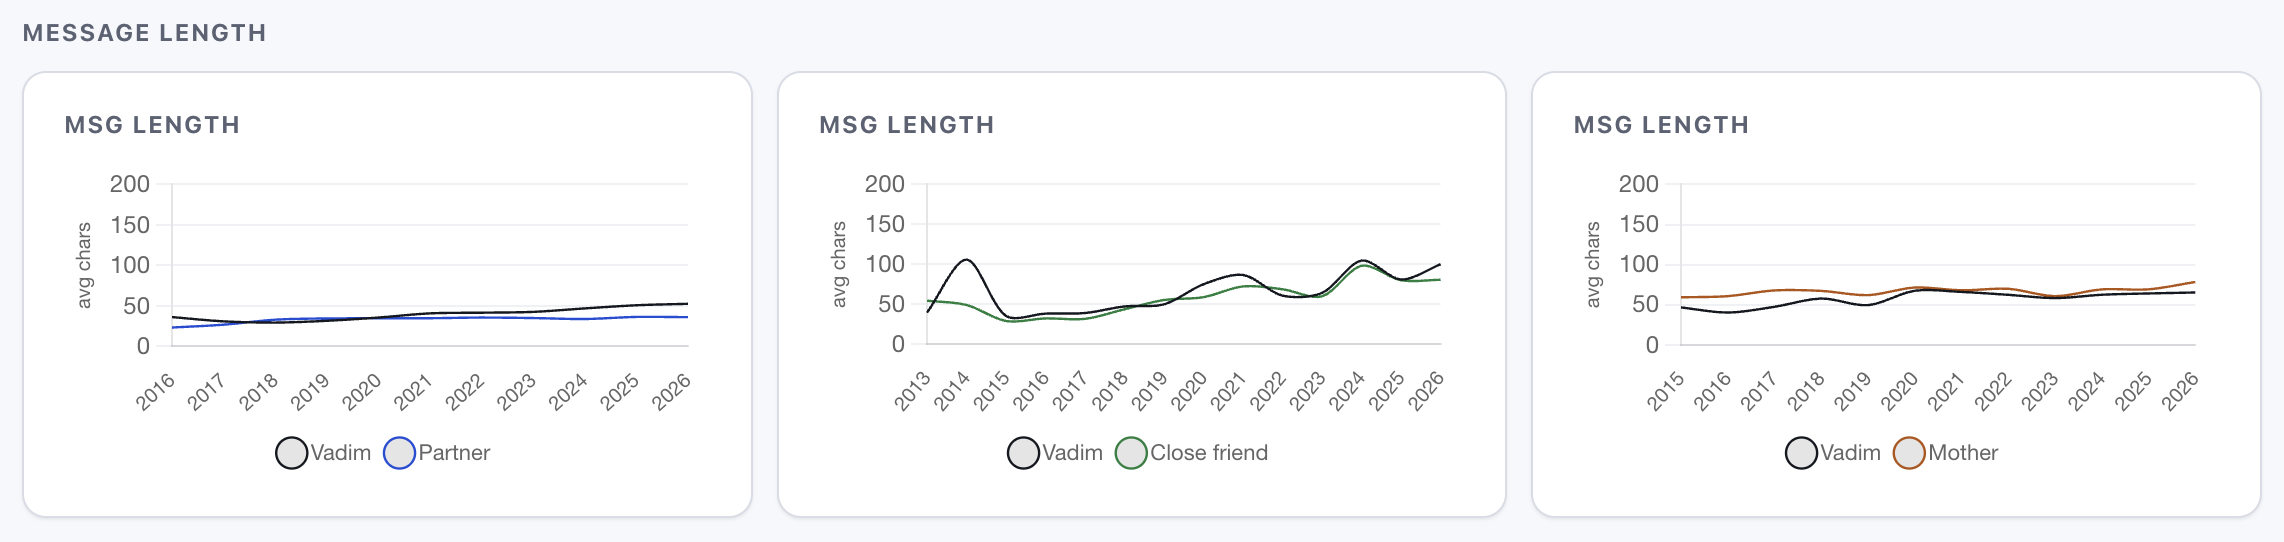
If not messages and their length, then what? Consider vocabulary overlap - in some of my relationships it went from 69.5% of our most-used words in common to 8.7%[9]9. Jaccard similarity of each person's top-100 words with mine, measured yearly. The divergence tracks the relationship cooling - we stopped talking about the same things.. We now use almost entirely non-overlapping vocabularies. A random message from either of us could be trivially attributed by word choice alone.
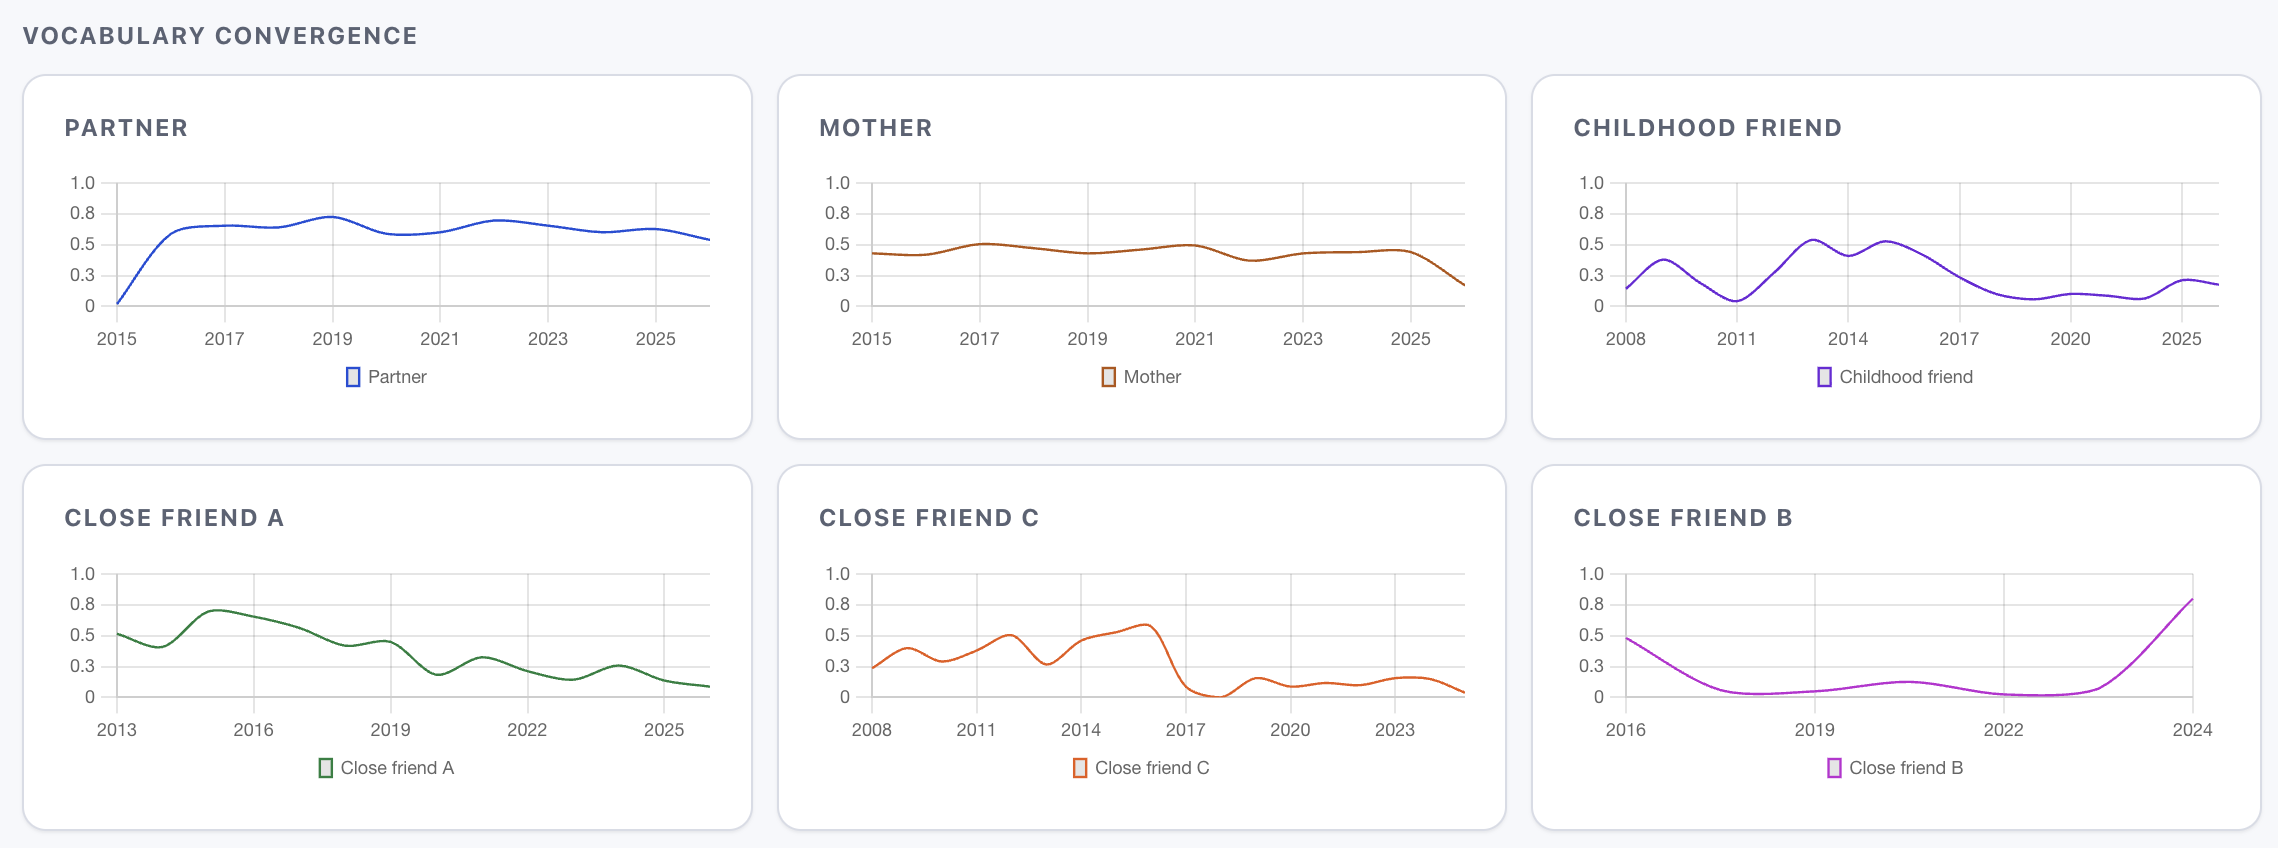
Does it mean we're not friends anymore? Not necessarily, but it does mean our interests differ way more than before - which might be a good thing as well.
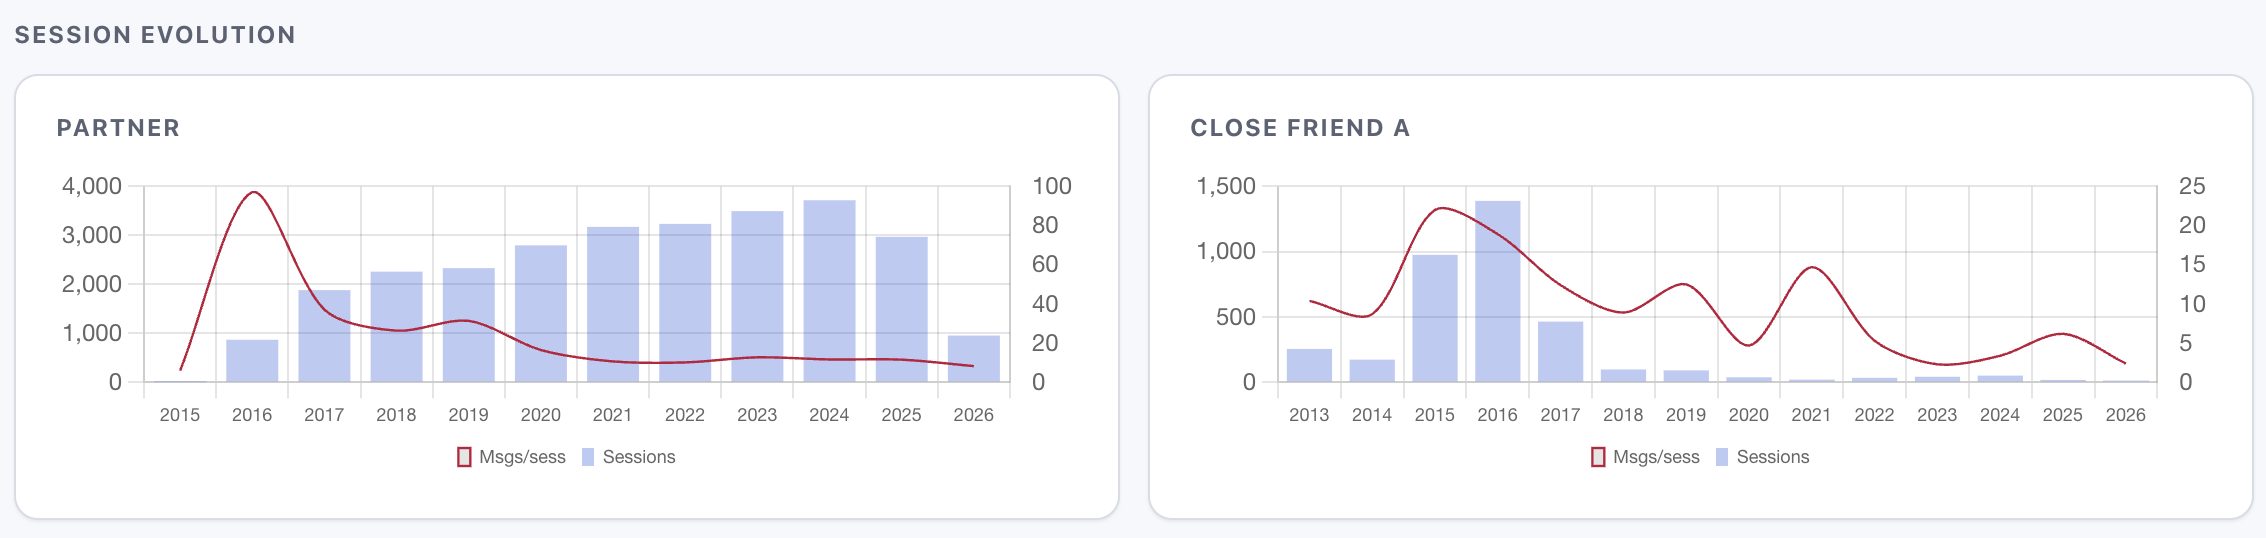
Another interesting metric is the session count versus messages per session. Interactions with my partner fragment into thousands of micro-check-ins (session count goes up, messages-per-session go down), while chats with another close friend collapse from multiple small sessions a day into thoughtful conversations a few times a month (session count goes down, messages-per-session go up).
I also had a look at response times, but they tell you more about someone's phone habits than their feelings. The delta across chats is small and grows with reply length - a better metric would have been time from receiving a message to reading it, but none of the exports give me that.
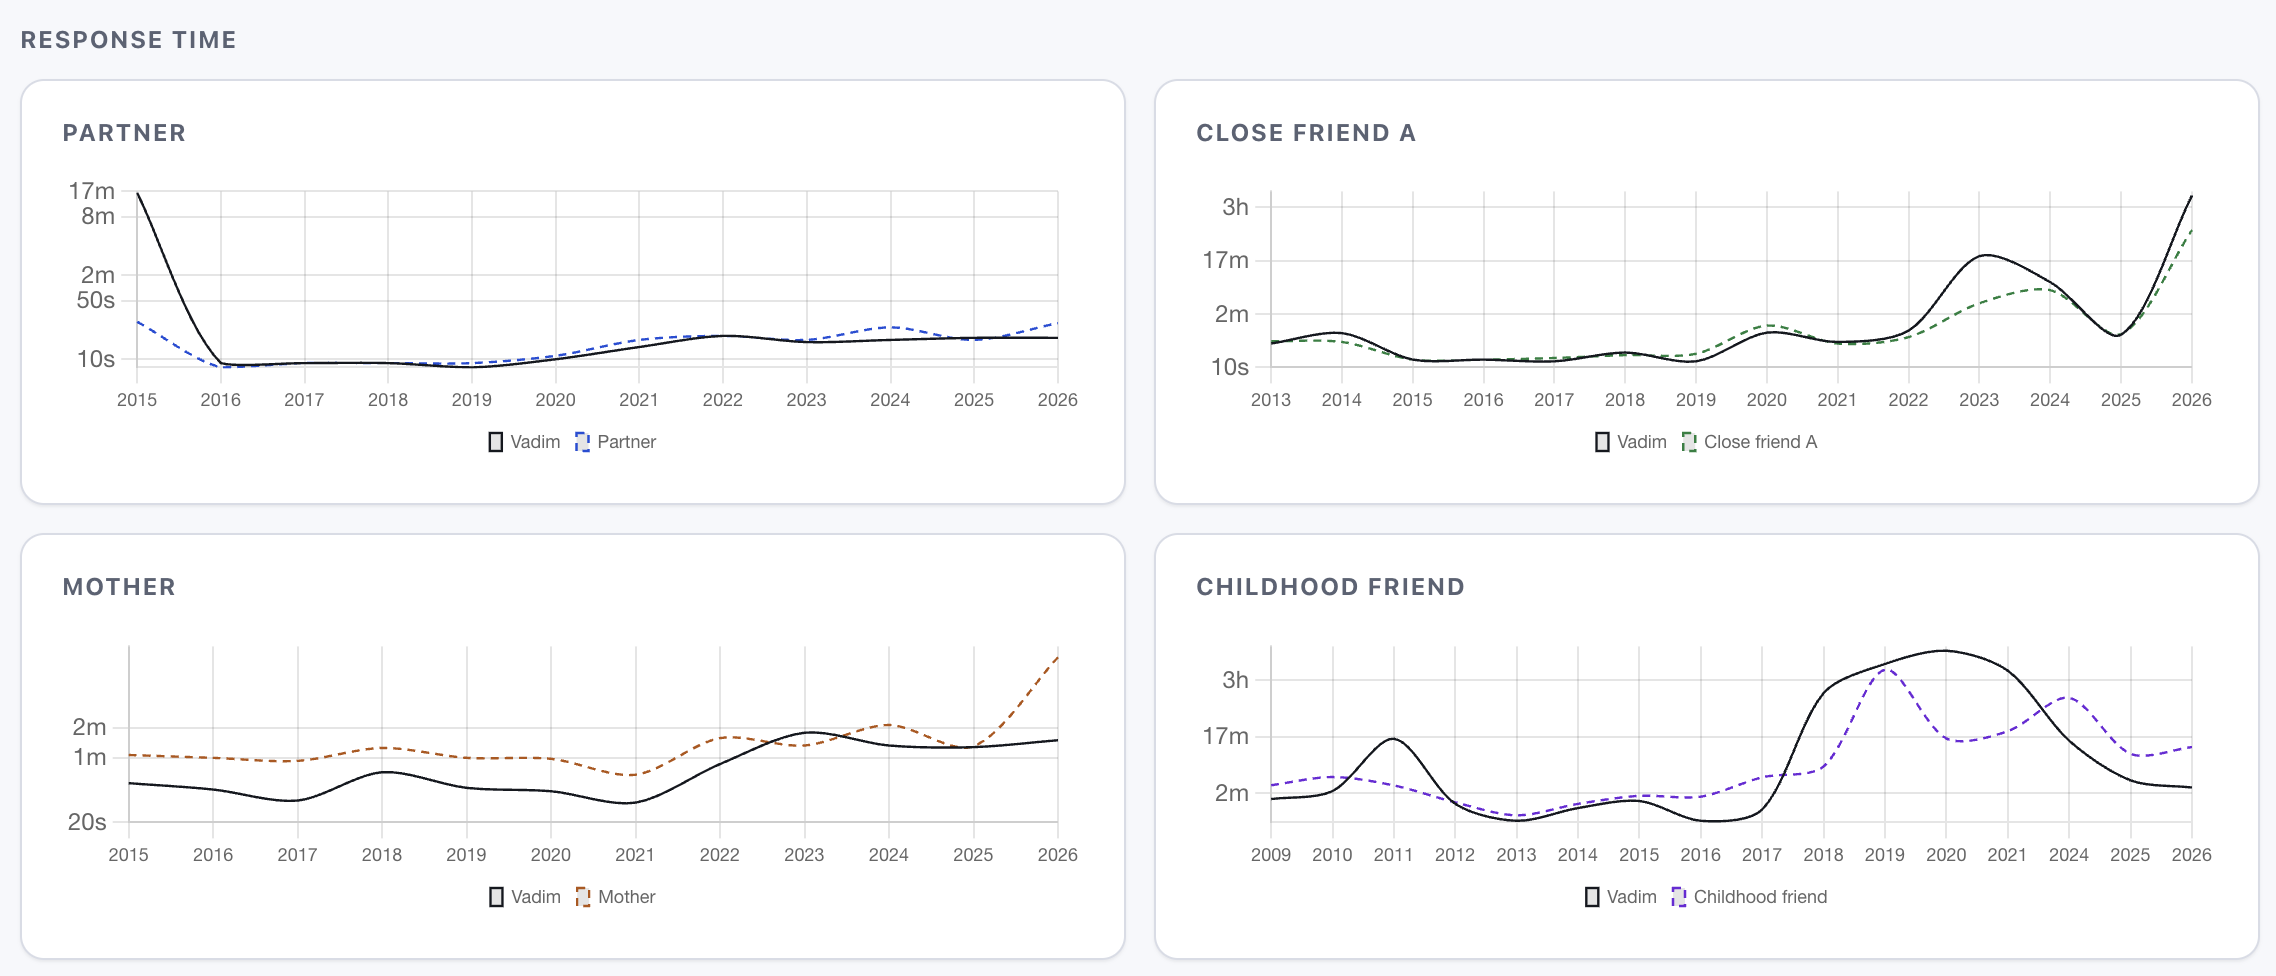
Ironically, on average I reply to the first message in the session with a large delay, but then reply to all follow up messages faster than every other person in my dataset replies to me - do I have too much time or nothing else to do? The gap is negligible for my partner and closest friends and grows for peripheral contacts.
In most conversations, when one person writes a long message, the other writes a long one back - this is called linguistic accommodation. I found a few chats doing the opposite: the longer I wrote, the shorter they replied.
I didn't find any cross-conversation emotional contagion - talking to one person didn't measurably affect the sentiment of my next conversation that day. Sadness doesn't leak across threads but neither does warmth, so all conversations are running in their independent tracks.
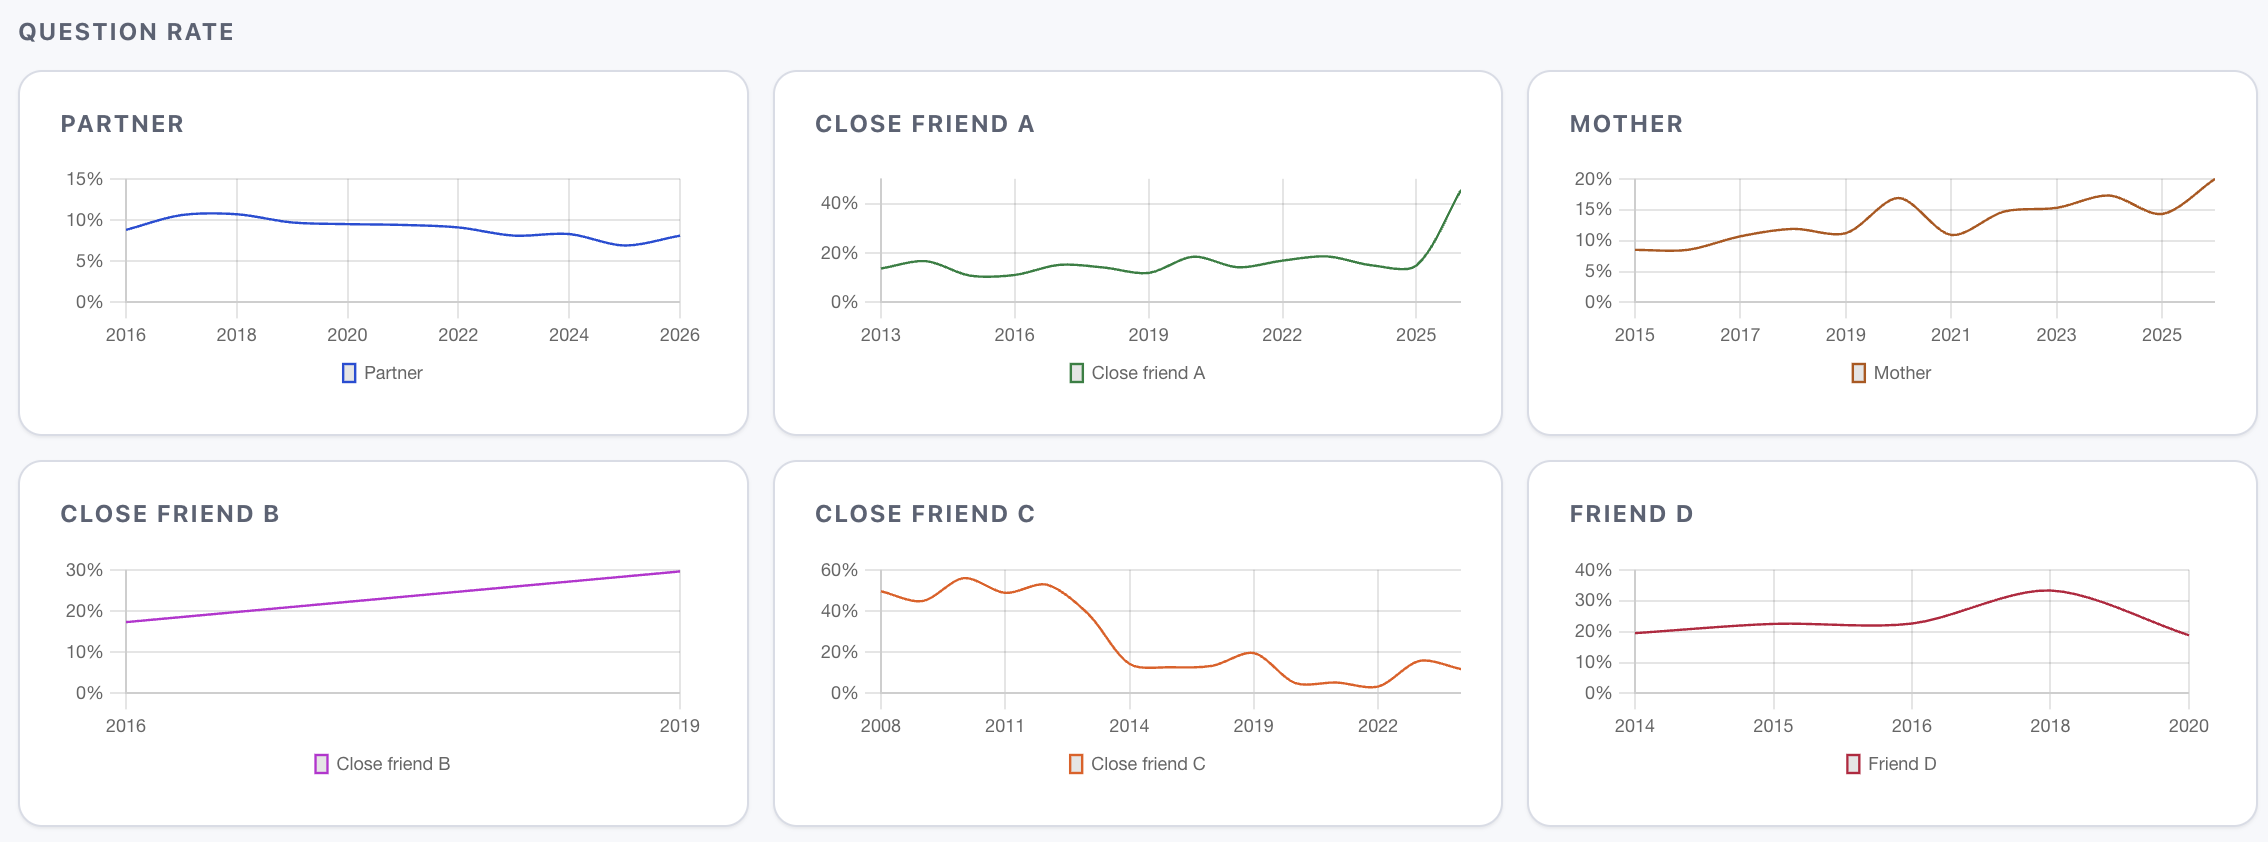
There's a theory that questioning declines as romantic relationships mature - you stop asking because you already know[10]10. Emma Pierson analysed 5,500 emails in a long-distance relationship and noticed that questions declined as the relationship matured. My data confirms this for deepening relationships but shows the opposite for thinning ones.. My partner data confirms this slightly (8.8% to 8.3% over nine years). But my close-friend and mother data show the opposite: questioning increased from 11% to 18.5% and 8.5% to 17.3% respectively, as those conversations thinned. When you only talk to someone occasionally, more of what you say is information-seeking. The question rate is an inverse proxy for relationship bandwidth.
Many people who tried analysing their chats before built cloud tags - something I hope I won't have to see ever again - so I focused on endearment frequency instead. It works well with the partner chat - there are three clear eras of vocabulary, each tracking certain stages of relationships and living arrangements:
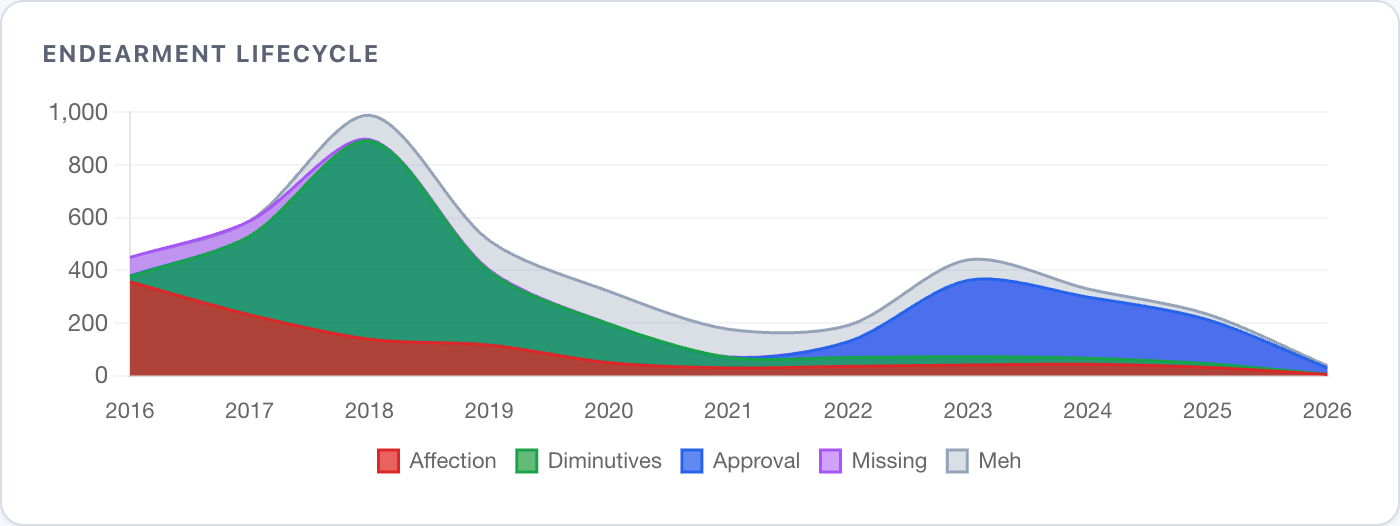
Longing and love declarations give way to dimunitives and pet language, and then give way to approval signals and jokes. When you're apart, text carries the emotion, but when you're together, it mainly captures the logistics as the emotional things are said in person.
After looking into my close circles, I went wider and looked up annual contact attrition - the amount of contacts that went silent after each year. Moving cities (2016) or abroad (2017) in my 20s was a bigger friendship extinction event than moving cities (2023) or abroad (2025) in my 30s. Without moving, I lose about 20 people a year.
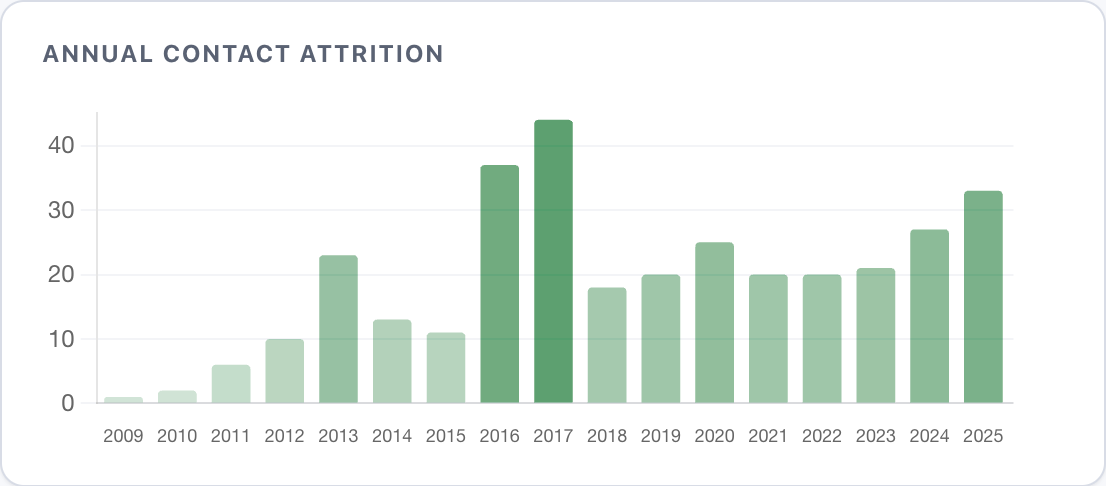
The median friendship in the dataset lasts three years, but 41 people went silent for 3+ years then reappeared.
That being said, most of these contacts are not necessarily friends. Robin Dunbar, a British anthropologist, found a correlation between primate brain size and average social group size, and then extrapolated it, suggesting humans can comfortably maintain 150 stable relationships. Then, he figured humans maintain relationships in concentric layers - about 5 people you'd call in a crisis, 15 close friends, 50 regular contacts, 150 active acquaintances.
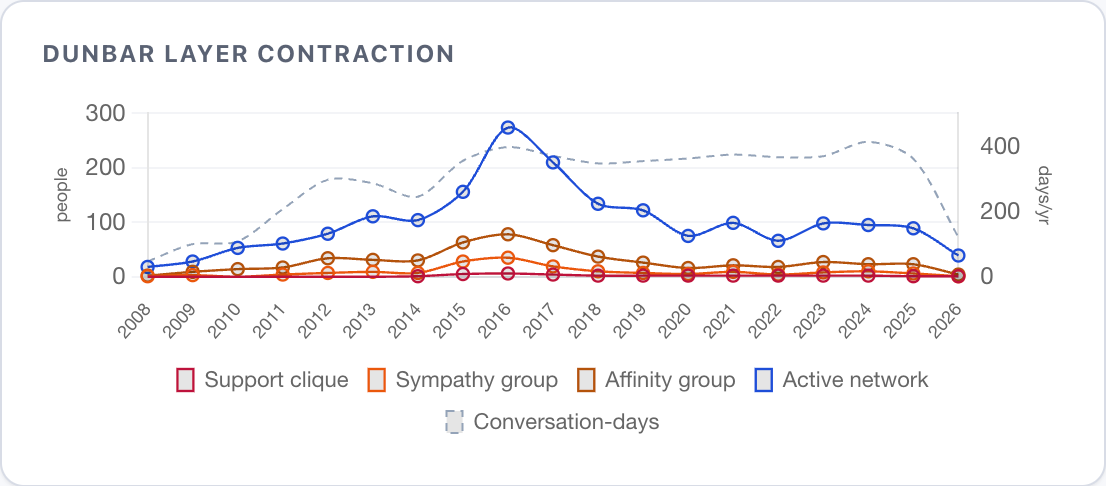
My support clique and active network shrink over years. But the total conversation-days per year stayed nearly flat at ~360 for six years straight - the pandemic didn't change it either, although it felt like they'd go up given the amount of coordination for binge-drinking over Zoom. Even though over years I lost 75% of my network, I didn't free up a single conversation-day, just kept redistributing the same ~360 days across fewer people.
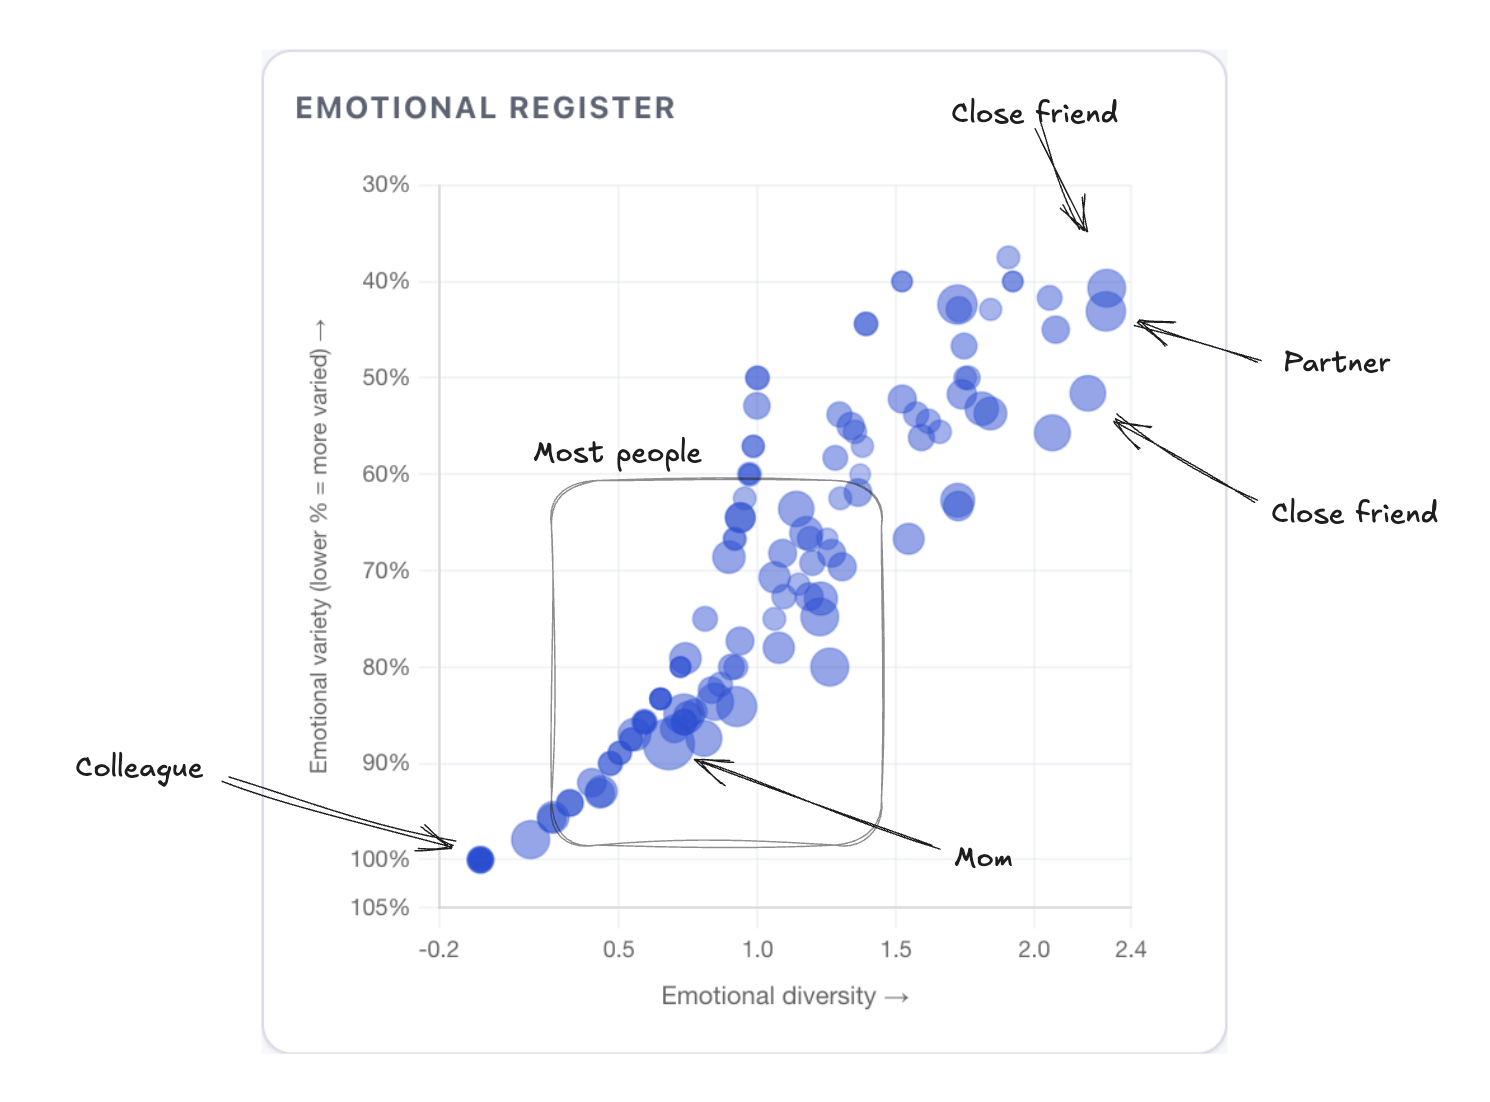
The chats with close friends are emotionally diverse - on a scatter plot of emotional diversity and dominant emotion's concentration most people cluster in the bottom-left (one dominant emotion, low diversity). My partner and close friends are at the top-right (many emotions, none dominant). Transcational chats with colleagues sit at the extreme bottom-left.
I would have described myself as "the supportive friend." The data says I'm equally "the advice friend" - mentoring (50 asymmetric days) nearly matches supportive (59). When someone needs me, my reflex is to explain, not to listen. I didn't know this.
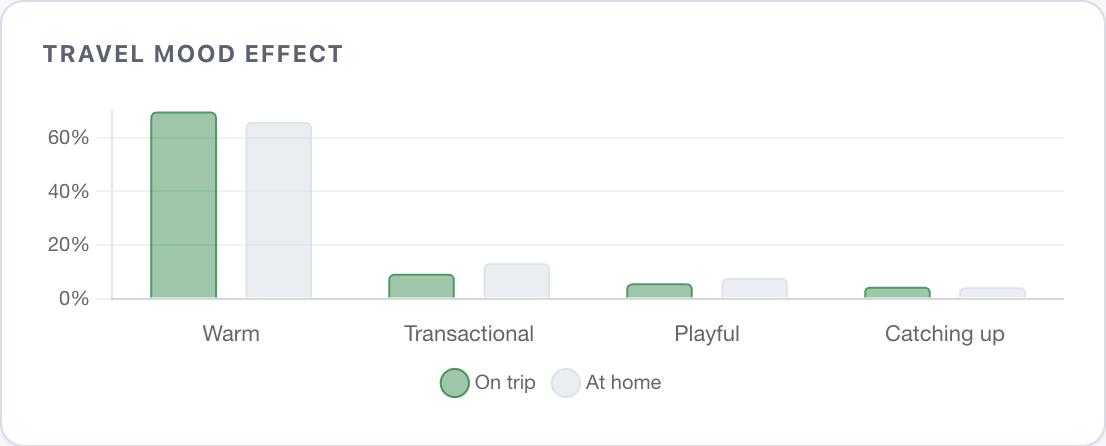
When I'm travelling, conversations with everyone get warmer (69.8% M:warm vs 65.9% at home) and less transactional (9.3% vs 13.2%) - most likely because I don't have to think about work.
I can also clearly tell when I had a 9-to-5 period of my life: my peak messaging hour migrated from midnight to midday.
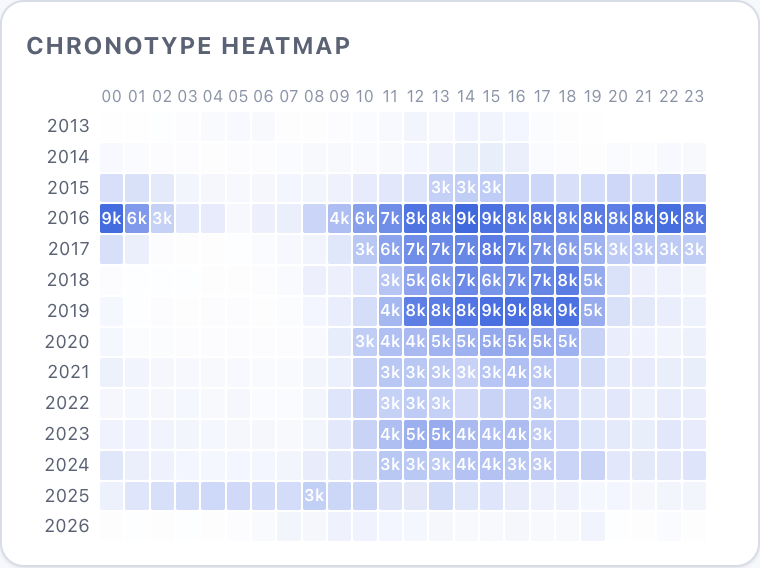
Evening-active people tend to have more friends but of lower quality[11]11. Roy et al. (2021), "Chronotype of social interaction", Scientific Reports. They classified chronotypes from call-record data and found evening-active users have wider but thinner social networks.. During my "midnight" years I had ~300 active contacts, but throughout the "midday" years it dropped to ~60.
Wait but why? 
My social life over two decades fits in 70 MB - smaller than a single iPhone photo burst.
I started this because Tim Urban's grid bothered me with its emptiness: school years, holidays, jobs marked on a finite timeline didn't make me feel good about my life. Each square is one week, and most of mine had nothing written in them.
Now they do, but not "moved to London" or "got married" - I'd have remembered those without help. The first message from someone who later became one of my closest friends, or the night a group chat kept everyone awake laughing, or the recipe someone shared offhand that I still cook every week.
I realised my life was never empty. My memory was just very selective.
The Obsidian 2D graph view didn't take 7,000 nodes well, so I brought it into three dimensions on Vision Pro.
It's a fun technical challenge - think dropping 26M calculations per tick to 50K with an algorithm borrowed from galaxy-collision simulations to hit 60fps - but that deserves a dedicated post. Subscribe to RSS or the newsletter to stay tuned.

 .
.This research didn't change how I talk to people. I still default to advice when someone needs listening, still show different people different versions of myself, still leave half my contacts on unread for days. But I went down a nostalgia rabbit hole I wasn't expecting and learnt things about my relationships I couldn't have seen one conversation at a time. I now know what my patterns look like from the outside - assuming someone else would bother running their chats through the same ten-step pipeline and looking me up.
As a side-effect, now I do have everything I'd need to be a better friend - last-contact dates and sentiment trajectories, their hopes and fears, names of their pets (often) and kids (sometimes), allergies and favourite meals. It answered a lot of questions I didn't even know I had.
Am I a bad friend though? I thought I'd have to ask 400 people to find out - apparently I only needed ten.
I did all of this to remember my friends' birthdays. Imagine what I'd do with your codebase →
Not bad per se - I just procrastinate a lot. Once I learnt to shoot and stalk deer because I wanted to cook a steak - and cooking is way easier than human interactions. ↩︎
A now-obscure social network, popular in the post-Soviet space in the noughties. I haven't been to Russia for a decade or so, but the archives going back to 2008 are still there. Gotta love totalitarian states, eh? ↩︎
Slavic languages often use a "-sha" suffix to create endearing diminutives, e.g Paul = Pavel = Pasha, Maria = Masha, Innokentiy = Kesha. ↩︎
Fine-tune a BERT model on labelled name-resolution pairs, predict which "Sasha" based on surrounding topics. ↩︎
BERT tops out at 75.6% F1 on event detection (Xi et al, MUSIED 2022) with a professionally annotated corpus in a single domain - I suspect multilingual banter with a small hand-labelled training set would do much worse. ↩︎
In total I ran 200+ sessions, roughly 15-20 billion tokens including context. On Opus, that's around $15k. On an M5 Pro 32 GB running Qwen3-30B-A3B locally via MLX, it's around 10-15 weeks of continuous inference. Pick your poison. ↩︎
Poria et al. (2019) showed you can't assign emotion to a conversation without tracking who said what. A message from Person A might read as angry in isolation but is sarcasm in context of their usual tone with Person B. ↩︎
What I didn't expect is finding out that on average, 12.9% of my conversations each month are transactional - but in March it's 17%. I have the UK tax-year-end to blame. ↩︎
Jaccard similarity of each person's top-100 words with mine, measured yearly. The divergence tracks the relationship cooling - we stopped talking about the same things. ↩︎
Emma Pierson analysed 5,500 emails in a long-distance relationship and noticed that questions declined as the relationship matured. My data confirms this for deepening relationships but shows the opposite for thinning ones. ↩︎
Roy et al. (2021), "Chronotype of social interaction", Scientific Reports. They classified chronotypes from call-record data and found evening-active users have wider but thinner social networks. ↩︎